
IR CO and OCS Observations at Galeras Volcano
Using the Gas Correlation Spectrometer: GASCOFIL
The goal of this study was to determine if it is possible to make remote sensing measurements on volcanic effluents using gas correlation
spectroscopy. Data at Galeras were collected on Jan. 10, 1993 prior to the Jan. 14 eruption with an IR gas correlation remote sensor,
GASCOFIL, which observes CO and OCS in the 4.8 micrometers region. These data were converted to column gas amounts using a
single-layer version of the HITRAN-based model. Average column densities of 155 ± 40 ppm-m CO (with the atmospheric component
subtracted out) and 6± 2 ppm-m of OCS were observed over a 1-km path into the actively out gassing volcanic crater. The observed
OCS/CO ratio of 0.039 ± 0.023 at Galeras may be typical of passive volcanoes but is an order of magnitude higher than erupting volcanoes.
This difference may result from OCS being absorbed on ash during eruptions and thus its removal from the gas phase.
Abstract
Introduction
After numerous field surveys GASCOFIL had proven to be a versatile remote sensing system which was readily adaptable to
new applications (Morrow and Nicholls, 1985, 1987, 1990, 1991; Morrow, 1995). This versatility was put to an extreme
test when GASCOFIL was used to monitor the active volcano Galeras (shown in figure 1) prior to its Jan. 14, 1993 eruption
Figure 1: The volcano Galeras in southern Colombia as seen from Pasto
(photo courtesy of Dr. John Stix)
Galeras is located in the Andes of southern Colombia 100 km north of the equator near the Ecuador border (lower left in
figure 2). It is considered to be the most restless volcano in Colombia, having had recent major periods of eruptive activity
between 1925 to 1936 and 1988 to 1994. The city of Pasto, population 300,000, is located 7 km east of the summit crater,
and numerous villages are situated on its flanks. An outer caldera, which is open to the west in a horseshoe-shaped
pattern, encloses the active cone (see figure 3). Galeras is the only “Decade Volcano” in South America, and was chosen for
intensive study during the 1990s as part of the International Decade for Natural Disaster Reduction program.
Figure 2: Map of Colombia showing location of Galeras Volcano enlargement
of area of small red box is shown in next figure
(Map courtesy of Nystrom.com division of Herff Jones Inc.)
Figure 3: Map showing the geometry of the Galeras GASCOFIL
survey and locations of the volcano and the city of Pasto
The Eruption of Galeras on Jan. 14, 1993
Galeras began its second active period of the twentieth century in 1988. Between 1989 and 1991 the volcano showed high
levels of SO2 flux and seismicity, emitting up to 5,000 metric tonnes/day of SO2 and exhibiting up to 400 long period
earthquakes per day (Charland, Morrow, Nicholls and Stix, 1993).
A series of explosive eruptions occurred on May 4th and 5th 1989, and a lava dome was in place by October 1991. Six
eruptions occurred in 1992 and 1993. These eruptions destroyed the lava dome and deepened the crater. The gas release
from over-pressured magma beneath the surface appears to have been the cause of these eruptions (Stix, Morrow,
Nicholls and Charland, 1996). During this period of eruptions the seismicity and gas release declined substantially.
The January 14, 1993 eruption was a sudden event with no clear warning from seismic or SO2 emission precursors. This
tragic event killed three tourists and six volcanologists who were attending the Galeras Decade Volcano Workshop in Pasto
(Munoz et al, 1993 and Williams, 1993). After observing Galeras with GASCOFIL, the author of this dissertation
attended the first session of this conference and then flew out of Pasto on the 12th to attend a scheduled meeting at the
University of Alabama in Huntsville. On the morning of Jan 15, 1993 the author received a call from his secretary in
Alliston Ontario that informed him of the eruption. Later that day he learned of his own demise in the Huntsville daily
paper, misinformation which resulted from the chaos surrounding the suddenness of the event. (Apparently the author
was mistakenly identified as one of the scientists who was killed during the eruption while making measurements in the
inner caldera.) During the survey reported here (made 4 days before the eruption), GASCOFIL remotely sensed gas in the
volcano while mounted on an overlook (a regional police station) on the outer caldera as shown in figures 3 and 4.
This overlook site was not significantly damaged during the eruption. This tragic event underlines the safety advantage of
the remote sensing method of gas measurement in volcanology work.
Remote Sensing Observations of Galeras using GASCOFIL by the Writer on Jan. 10th 1993
Measurements were carried out from the police station patio located (see figure 4) on the eastern face of the outer caldera.
Figures 4 and 5 show how the western wall of the inner caldera was visible from this vantage point. GASCOFIL sensed IR
emission from this wall after it passed through a composite plume formed (see figure 5) by emissions from several
fumeroles (volcanic vents) on the walls and floor of the crater.
Figure 4: The geometry of the Galeras observations
The goal of the measurements was simultaneously to measure CO and OCS concentrations and calculate the CO/OCS
ratio. CO and OCS were chosen because theses gases are thermodynamically important during degassing (Gerlach and
Nordlie, 1975) and because they both can be measured in the same IR wavelength region at 4.8 µ. The effects of wind
dilution, which are difficult to estimate in the turbulent region inside the crater, were eliminated by using the gas ratio.
This approach may therefore be used to reveal the desorption rates of two gases with different thermodynamic properties
from the subsurface magma and may be used to relate eruptive activity to gas solubilities in Magma (Stoiber et al., 1983) It
may be possible, after sufficient development of the method, to forecast eruptions by changes in gas ratios. This work was
an initial step to that end.
GASCOFIL was outfitted with a 454 torr CO cell, a 52 torr OCS cell and two clear cells for the measurements. Otherwise
the design was as discussed in sections 3.1, 3.2, 3.3 and 3.4. During the measurements, the Cassegrain telescope was
removed in order to give GASCOFIL a larger field of view (10 degrees). This projection of this field of view on the inner
Caldera wall was a circular area approximately 170 metres diameter. As seen in figures 4 and 5, this area was sufficiently
large to observe the gas from a number of vents (fumaroles) in the inner caldera.
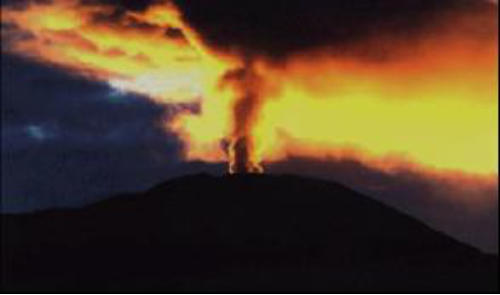
Figure 5: Galeras on Jan. 10, 1993, the circle shows the projected
field of view of GASCOFIL at the volcanic crater wall
While observations were made on Jan. 8th, 9th and 10th 1993 only the observations from Jan. 10th are presented here
because this was the day most nearly free of cloud. Even so, the weather on the 10th was variable with frequent episodes of
cloud which drifted in rapidly from the north. This cloud acted like a shutter when it interposed itself between GASCOFIL
and the inner caldera. This conveniently provided a zero gas target since the cloud was sufficiently thick to block the IR
from the volcano.
A representative segment of the GASCOFIL data gathered on the 10th is shown in figure 6, The abscissa shows the time in
seconds. The left hand ordinate shows the correlation signals, DS/S. The right hand ordinate shows the surface
temperature in the field of view of GASCOFIL. This temperature was determined from the radiometric calibration of the
sensor against a variable-temperature calibration target of a rock sample characteristic of the rocky side of Galeras’ inner
caldera.
The top set of data points show the correlation signals for carbonyl sulfide (OCS). The middle set of data points show the
correlation signal for carbon monoxide (CO). The bottom trace in figure 6 shows the IR radiant temperature. A solid bar
of data points at correlation level zero are an artefact of the plotting method and have no significance.
Figure 6: Galeras remote sensing observations with GASCOFIL 1, shows the
COS correlation signal while viewing the volcano, 2 shows the CO correlation
signal while viewing the volcano, 3 shows the OCS and CO correlation signals
when the volcano was blocked by clouds and 4 shows the radiant temperature
derived from GASCOFIL’s IR signal
The correlation signals clearly increased when the clouds cleared and the inner caldera was visible (between 41700 and
42200 seconds). This can be seen clearly when the levels of correlation in both channels (3 on the chart) increase at 41500
seconds to the levels shown in 1 and 2. In addition to the use of the correlation signals when a cloud was present to give
the zero, zero was also determined by interposing calibration targets immediately in front of GASCOFIL. These zero
measurements and calibration measurements made with a variable-temperature target and gas cells (before and after the
data segment shown) confirmed the stability of the zero and slope of GASCOFIL’s response to CO and OCS during the
survey.
During this survey, the scene radiant temperature, determined from the clear cell radiant signal from GASCOFIL (4 in the
figure), ranged between 10 C and 35 C. The lowest observed radiant temperature occurred with the cloud interposed itself
in the GASCOFIL field of view. As expected the radiant temperature of the cloud determined from the GASCOFIL clear
cell signal was near the 11 C ambient air temperature. The highest levels of the radiant temperature were observed when a
35 C black body radiance was interposed in GASCOFIL’s field of view. When the cloud cleared the radiant temperature
was observed to be between 19 to 22 C. The average temperature of this wall exceeded the air temperature by 8 to 11
degrees C. This was not surprising since the inner wall was subject to both geothermal and solar heating.
Discussion and Conclusions
The goal of this survey was to determine if it is possible to make remote sensing measurements on volcanic effluents using
gas correlation spectroscopy. To determine if the measurements produced reasonable results, the gas correlation signals
obtained on Jan. 10th were analysed using a single-layer version of the HITRAN-based model. These data produced
column CO and OCS concentrations (in ppm-m). Average column densities of 155 ± 40 ppm-m CO (with the atmospheric
component subtracted out) and 6± 2 ppm-m of OCS were observed over a 1-km path into the actively out gassing volcanic
crater. HITRAN modelling of interference effects (Stix, Morrow, Charland and Nicholls, 1996) indicated that there was no
significant interference on CO, while OCS measurements may have had small interferences from CO, H2O and/or CO2.
The OCS/CO ratio of 0.039 ± 0.023 at Galeras may be typical of passive volcanoes but is an order of magnitude higher than
erupting volcanoes. In the worst case, (when the maximum estimated errors are factored into the ratio) the observed
OCS:CO has a low value of 0.024 and a high value of 0.056.
The OCS and CO levels were compared to each other and to the SO2 level measured simultaneously by a dispersive
correlation spectrometer (COSPEC) by our group. Given that these were the first measurements made with gas correlation
spectroscopy of gas inside a volcanic caldera no baseline data for a non pre-eruptive volcano were available. However the
OCS:CO ratio from Galeras is the same order of magnitude as that calculated thermodynamically from fumaroles at
Augustine (0.15) (Belviso et al., 1986). The higher OCS:CO ratio at Augustine may be caused by hotter fumaroles there
(870 C) than at Galeras (200-600 C) (Belviso et al., 1986). On the other hand, OCS:CO ratios at Galeras and Augustine
during times of passive outgassing are about an order of magnitude higher than those at Mt. St. Helens and Soufriere (St.
Vincent) during explosive eruptions (Cronn and Nutmagul, 1982a; 1982b). This difference may result from OCS being
absorbed on ash during eruptions and thus its removal from the gas phase (Rasmussen et al., 1982).
The data support the hypothesis that the OCS:CO, OCS:SO2 and CO:SO2 ratios all increase prior to volcanic eruptions but
in no way should be considered conclusive given the variety of thermo-chemical environments and the small set of data
gathered.
It is interesting to note that these ratios may increase even when the total emitted gas is showing a decreasing trend due to
sealing or capping of the fissures or subsurface vents. These ratios might be a better predictor of volcanic eruptions than
total gas emissions which depend on both the source (offgassing magma) and the impedance through the subsurface vent
system (which can be sealed by upwelling magma). These preliminary observations suggest that very important future work
using correlation spectroscopy can be done in this field.
References
S. B. Belviso, C. Nguyen, and P. Allard, “Estimate of Carbonyl Sulfide (OCS) Volcanic Source Strength Deduced from
OCS/CO Ratios in Volcanic Gases”, Geophys. Research Lett., 13, 113-136, (1986).
A. Charland, W. H. Morrow, R. W. Nicholls and J. Stix, “Correlation Spectrometer Observations of SO2, CO and OCS
Emitted from the Galeras Volcano 9‑10 Jan 1993", Proceedings, (pp4) of the OSA Topical Conference on Optical Remote
Sensing of the Atmosphere, Salt Lake City Utah, 8‑12 (March 1993).
D. R. Cronn, and W. Nutmagul, “Characterization of Trace Gases in 1980 Volcanic Plumes of Mt. St. Helens”, J. Geophys.
Res., 87, 11153-11160 (1982a).
T. M. Gerlach, B. E. Nordlie, “The C-O-H-S Gaseous System, Part II: Temperature, Atomic Composition , and Molecular
Equilibria in Volcanic Gases,” Am J. Sci., Vol 275, pp. 377-394, (1975).
W. H. Morrow,"MicroMAPS‑a Lower Cost Orbital Remote Sensor for the Detection of CO and N2O", SPIE Proceedings
Volume 2553 paper 51, Infrared Spaceborne Remote Sensing III, San Diego CA., Volume 25, 53, pp 116‑125 (1995).
W. H. Morrow, R. W. Nicholls, "To Establish a Canadian Validation Technology as Part of a Network To Validate Global
Carbon Monoxide Measurements and to Verify The Performance of a Small Satellite Remote Sensor, MicroMAPS", Final
Report DSS/CSA Contract 9F028‑4‑3‑3190/01‑XSD, (March, 1995)
W. H. Morrow, and R. W. Nicholls, “Simulation of Optical Nadir Viewing Gas Correlation Spectrometer for Detection of
CH4 and CO at 2.3 Microns”, Proceedings of OSA Topical Conference on Optical Remote Sensing of the Atmosphere (pp.
84‑86), Williamsburg Va, (Nov 1991).
W. H. Morrow, and R. W. Nicholls, “Some Recent Measurements of the CO Overburden Of Forest Fire Emissions With Gas
Filter Correlation Spectrometers GASCOFIL and GASCOSCAN”, Proceedings of the Optical Society of America Topical
Conference on Optical Remote Sensing of the Atmosphere, Incline Village, Nevada, pp. 332‑335, (Feb 1990).
W. H. Morrow, and R. W. Nicholls, “GASCOSCAN and GASCOFIL: Remote Sensing Correlation Spectrometers And
Tropospheric Trace Gas Measurements”, Proceedings of the Optical Society of America Topical Conference on Laser and
Optical Remote Sensing Instrumentation and Technology (pp 181‑183) North Falmouth Mass, (August 1987).
W. H. Morrow, and R.W.Nicholls, “GASCOFIL: A Gas Correlation Filter Spectrometer For Remote Sensing Of Trace
Atmospheric Constituents”, Proceedings of Optical Society of America, Topical conference on Atmospheric Remote
Sensing (pp WC19, 1‑4),Incline Village Nev. (Feb 1985).
F. A. Muñroz, M. L. Calvache V., G. P. Cortes, D. M. Gomez, L. Narvaez, M. Ordoñez, R. Torres, B. Silva, Sn. N. Williams, C.
O. Sanders, and J. Stix, “Galeras Volcano: International Workship and Eruption”, EOS, Trans Am. Geophys. Union, Vol 74,
pp. 281-287 (1993).
R. A. Rasmussen, M. A. K. Khilil, R. W. Dalluge, S. A. Pewnkett, and B. Jones, Carbonyl sulfide and carbon disulfide from
eruptions of Mount St. Helens, Science, 215, 665-667, (1982).
R. E. Stoiber, L. L. Malinconico and S. N. Williams, “Use of the Spectrometer at Volcanoes”, In Forecasting Volcanic Events,
edited by H. Tazieff and J.-C Sabroux, Elsevier, Amsterdam, pp. 425-444, (1983).
J. Stix, , W. H. Morrow, R. Nicholls, A. Charland, "Infrared Remote Sensing of CO and COS Gas emitted by the Galeras
Volcano, Colombia, January 8‑10, 1993", Canadian Journal of Remote Sensing, 22:297-304, (September 1996).


Copyright Resonance Ltd., December 2011
143 Ferndale Drive North, Barrie, ON L4N 9V9 Tel: 705-733-3633 Fax: 705-733-1388 Email:sales@resonance.on.ca